Inside TM Flow Technology: From Blood Pressure Cuffs to Photoplethysmography
A plain-language look at the sensors behind TM Flow-style assessments: pressure cuffs, light-based pulse readings, heart-rhythm timing and skin-contact signals.
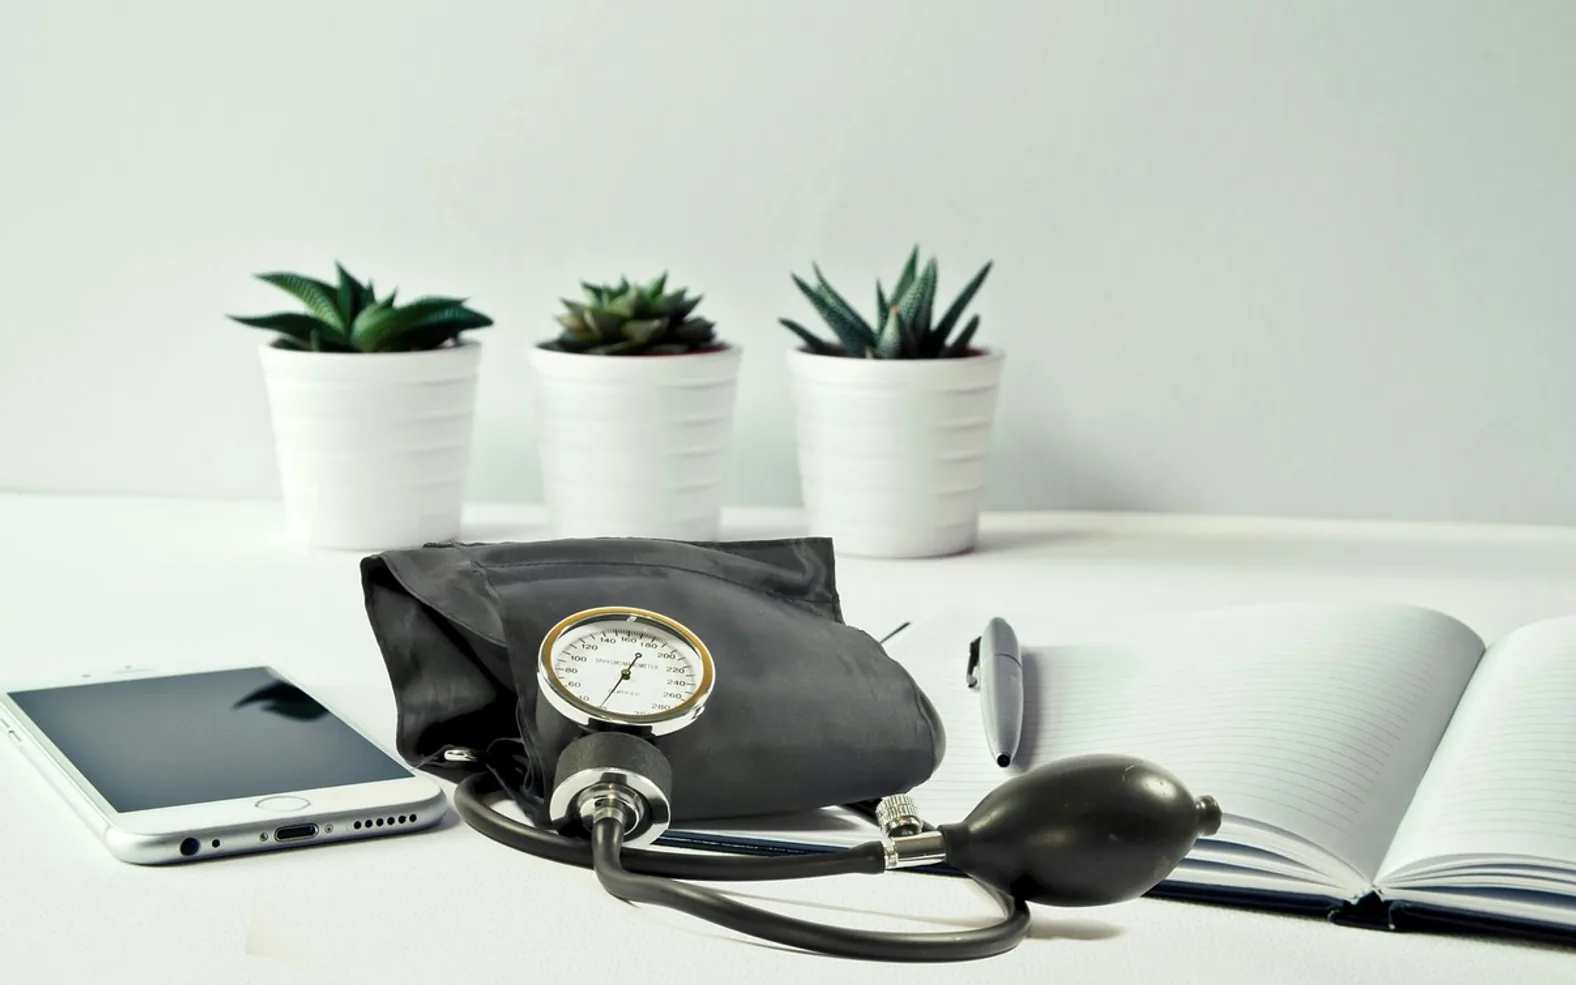
Some clinics now run a short, non-invasive assessment that bundles several familiar measurements into one session. A patient sits or lies down, a cuff goes on the arm, a small clip or sensor rests on a finger, and contact pads may touch the hands or feet. A few minutes later, software presents the readings as charts for the clinician to review.
Systems of this kind are often discussed under the name TM Flow. This article explains, in plain terms, what the individual sensors actually pick up and why the readings only make sense in the hands of a qualified professional. It is not medical advice, and nothing here should be used to interpret your own results.
Several old tools in one session
None of the underlying sensing methods is brand new. Pressure cuffs have been in clinics for well over a century, and light-based pulse sensing sits inside many fingertip devices and wearables. What a combined platform adds is coordination: it records several signals at the same time, under a consistent protocol, and lays them side by side.
That coordination is useful because the body's circulation and its automatic regulation are linked. Seeing several signals together can give a clinician a broader picture than one isolated number, provided the limits of each signal are kept in mind.
The cuff: pressure and the arteries
An automated blood pressure cuff inflates until it briefly restricts blood flow in the arm, then lets air out gradually. As the pressure falls, small oscillations caused by the pulse change in size, and the device's algorithm uses that pattern to estimate the upper and lower pressure values.
Cuff readings are sensitive to ordinary factors: cuff size, arm position, recent caffeine or exercise, talking during the measurement and even nerves about being measured. Clinicians usually look at repeated readings and context rather than relying on a single result.
Light at the fingertip: photoplethysmography
Photoplethysmography, usually shortened to PPG, sounds complicated but rests on a simple idea. A small light shines into the skin and a sensor measures how much of it comes back. With each heartbeat, the volume of blood in the tiny vessels under the skin changes slightly, and so does the amount of light absorbed. The result is a waveform that rises and falls with the pulse.
From that waveform, software can derive the pulse rate and describe the wave's shape and timing. PPG is convenient and comfortable, but it is also easily disturbed. Movement, cold hands, nail polish, ambient light and pressure on the sensor can all distort the signal, which is why a calm, steady setup matters.
Timing between beats
A healthy heartbeat is not perfectly regular. The interval between one beat and the next varies slightly, influenced partly by the autonomic nervous system, the part of the nervous system that runs things we do not consciously control, such as heart rate and blood vessel tone. Measuring those beat-to-beat differences is called heart rate variability analysis.
Some assessments ask the patient to breathe in a paced rhythm or change position during recording, because those simple actions are known to influence heart rhythm. How the intervals respond is one piece of information a clinician may consider. Variability is affected by age, fitness, sleep, stress, medication and many other factors, so it is never meaningful on its own.
Signals from the skin surface
Certain platforms also include electrodes that touch the palms or soles and measure small electrical properties at the skin. These readings relate to sweat gland activity, which is also governed by the autonomic nervous system. Temperature, skin condition, hydration and electrode contact all influence the result, so standardized preparation is important.
Software organizes, people interpret
The software in a system such as TMFlow gathers the readings, applies its processing and produces a report that is easier to review than raw signals. That convenience is genuine, but software does not remove uncertainty from the measurements beneath it. A tidy chart can still reflect a noisy recording.
This is why results belong with a qualified clinician who knows the patient's history, symptoms, medications and other test results. Such assessments are generally described as supporting a clinician's evaluation; they do not by themselves establish a diagnosis or determine treatment.
What patients can reasonably ask
Anyone offered this kind of assessment can reasonably ask a few straightforward questions:
- Why is the test being suggested in my situation?
- How should I prepare, for example regarding food, caffeine, exercise or medication?
- Who will review the results, and how will they be explained to me?
- Will any follow-up testing be needed, and is the assessment covered by my insurance?
Clear answers help set realistic expectations and make the appointment more useful.
What clinics weigh before adopting it
For practices, the device itself is only part of the decision. Staff need training to run the protocol consistently, the room should be quiet and comfortable, and there must be a clear policy on who reviews reports and how results feed into care. Data protection is part of the picture too, since recordings are health information and must be stored and shared under the applicable rules.
Handled carefully, combined assessments can give clinicians an organized view of several circulation and nervous-system signals in one visit. The value comes from good technique, honest interpretation and the professional judgment that ties the readings back to the person in the chair.
Fresh in every section
Got a topic idea?
A short note is enough.